ETF Overlap: How to Check What Your Funds Share
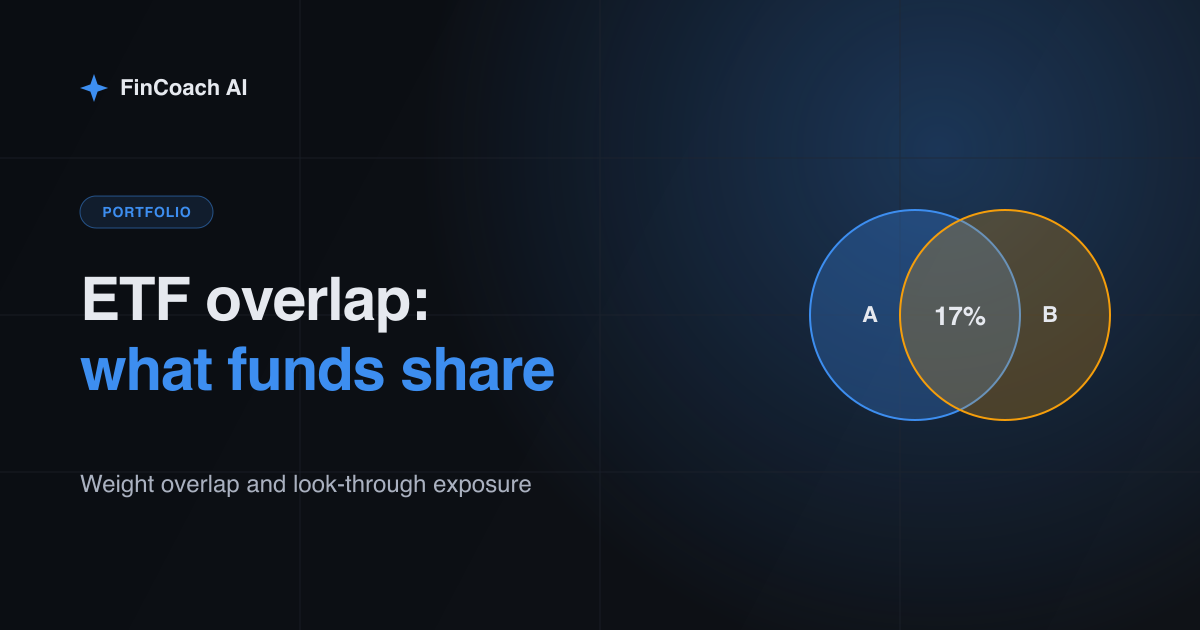
ETF overlap is the share of one fund’s portfolio that is also held by another fund. You measure it by lining up both funds’ published holdings and adding, for every company they share, the smaller of the two weights; two funds with 60% overlap are, for that 60%, the same investment.
It matters because owning three funds isn’t the same as owning three different things. Below is how to calculate overlap and your combined exposure to a single company, followed by the other checks worth running before you add an ETF to a portfolio.
Where do you find an ETF’s holdings?
On the fund’s own website. Since the SEC adopted Rule 6c-11 in September 2019, most ETFs must provide “daily portfolio transparency on its website”, in the words of the SEC’s announcement. The daily file lists each holding with its weight as a percentage of the fund, and most issuers let you download it as a spreadsheet.
There are exceptions. Some actively managed ETFs operate under separate exemptions and don’t publish full holdings every day; the prospectus says how often they disclose. Mutual funds usually report holdings quarterly, so an overlap check against a mutual fund uses older data.
How do you calculate overlap between two ETFs?
Download both holdings files and match the companies. For each company held by both funds, take the lower of its two weights. Add those numbers up, and the total is the overlap by weight.
Say Fund A holds Company 1 at 7%, Company 2 at 6% and Company 3 at 5%, and Fund B holds Company 1 at 12%, Company 2 at 11% and Company 3 at 4%. The overlap from those three is 7% + 6% + 4% = 17%. Companies held by only one of the funds add nothing.
Counting shared names is a weaker test. Two funds can share 400 companies and still differ a great deal if the weights differ, or share only 20 names that make up half of each fund. Weight overlap captures that difference; a raw count doesn’t.
Doing it in a spreadsheet
- Download each fund’s holdings file and paste the ticker (or CUSIP) and weight columns into two sheets.
- In the first sheet, look up each company’s weight in the second fund. A lookup that finds nothing means zero.
- Add a column with the smaller of the two weights for each row, using MIN.
- Sum that column. The total is the overlap by weight; sort the column to see which companies drive it.
Match on an identifier rather than the name, because issuers write company names differently and some companies have two share classes. The SEC’s rule asks ETFs to list a ticker and a CUSIP or other identifier for each holding, though staff reviews have found some sites leave the identifier out. Weights change every day as prices move, so an overlap figure is a snapshot of one date.
What is your look-through exposure?
Overlap compares two funds. Look-through exposure answers the question that matters for your money: how much of your whole portfolio ends up in one company once you add up every fund that holds it.
Multiply each fund’s weight in your portfolio by the company’s weight in that fund, then add. If 60% of your portfolio is in Fund A and 40% in Fund B from the example above, your exposure to Company 1 is 0.6 × 7% + 0.4 × 12% = 4.2% + 4.8% = 9.0%. If you also hold Company 1 directly at 5% of your portfolio, the true figure is about 14%, which is a much larger single-company bet than any one line in your account suggests. The guide on how much to hold in one stock covers what that kind of number can mean.
The same arithmetic works for sectors and countries. Fund pages usually publish a sector breakdown, so you can estimate how much of your portfolio sits in technology or in one country across all your funds.
What else should you check before buying an ETF?
Overlap tells you whether a fund adds something new. These checks tell you what the fund is and what it costs:
- What it tracks. An index fund follows a published index; the index rules decide which companies get in and how they’re weighted. Investor.gov notes that index funds usually trade less and charge lower fees than actively managed funds (Investor.gov, ETFs).
- The expense ratio. Investor.gov defines it as the percentage of a fund’s average net assets used each year to pay operating expenses, and says you’ll find it in the prospectus fee table (glossary).
- Concentration inside the fund. Add up the top ten weights. A fund that puts half its money in ten companies behaves differently from one where the top ten are 15%.
- Tracking difference. Compare the fund’s return with its index’s return over several years. Fees and trading costs mean an index fund usually trails its index slightly; a large or erratic gap deserves a look at the annual report.
- Trading costs. The bid-ask spread is a cost every time you buy or sell. Funds with little trading volume, or holding hard-to-trade assets, can have wider spreads.
The fund’s prospectus and summary prospectus cover the strategy, the risks and the fee table. FINRA’s Fund Analyzer shows how different fee levels add up over time.
How much does the expense ratio cost you?
Multiply the expense ratio by the amount invested. On a hypothetical $20,000 holding, an expense ratio of 0.03% costs about $6 a year and one of 0.50% costs about $100 a year. The fee is deducted from the fund’s assets, so you never see a bill; it shows up as a slightly lower return.
Investor.gov puts it directly: even small differences in fees “can mean large differences in returns over time”, and a high-cost fund has to perform better than a low-cost one to deliver the same return. Fees are the one part of a fund’s return that is known in advance.
Does overlap mean you should sell a fund?
Not necessarily. Some overlap is deliberate: an investor might hold a broad market fund and add a smaller fund to lean into one sector on purpose. The check is whether the overlap is something you chose or something you didn’t know about.
High overlap combined with a higher expense ratio is the pattern worth a second look, because you may be paying extra fees for exposure you already own. Whether to change anything depends on your goals, taxes and costs of switching, which are personal decisions this post can’t make for you.
How FinCoach AI shows fund exposure
FinCoach doesn’t run a holdings-file overlap calculator. What it does show helps with the look-through question from the stock side. The Analyze stock report for any company lists the major ETFs that hold it, alongside institutional ownership, so you can see which of your funds already give you exposure to a stock you’re researching.
In Portfolio, the AI Coach answers questions grounded in your own holdings, such as “How concentrated am I right now?”, and Stock Radar has an ETFs theme list with price, YTD change and distance from the 200-day moving average for each fund. Claude writes the coach’s answers; they can be wrong and aren’t advice, so check a fund’s published holdings file before relying on any exposure figure.
Keep reading
- How to diversify a portfolio
- How much of your portfolio should be in one stock?
- How to research AI stocks by theme
- Investing calculators
Educational, not financial advice. FinCoach AI is not a broker or investment adviser, and AI output can be wrong; check anything important before you act. Figures as of 22 November 2026; sources linked.
See which funds hold a stock you’re researching. Launch the app.
Launch appFrequently asked questions
What is a good ETF overlap percentage?
There is no standard threshold. Low overlap means a second fund adds exposure you don’t already have, while high overlap means much of the second fund repeats the first. Whether that’s a problem depends on whether the overlap was intentional.
How do I check ETF overlap for free?
Download both funds’ daily holdings files from the issuers’ websites, match the companies they share, and add the lower of the two weights for each shared company. The total is the overlap by weight.
Do S&P 500 and total market ETFs overlap?
Yes, heavily. A total US market fund holds the large companies in the S&P 500 plus thousands of smaller ones, and because funds like these are weighted by market value, the large companies make up most of both funds.
Where do I find an ETF’s expense ratio?
In the fee table of the fund’s prospectus or summary prospectus, which is usually linked from the fund’s web page. Fund pages and brokers also display it, but the prospectus is the official figure.
Is owning more ETFs better diversification?
Not automatically. Several funds that hold the same large companies can leave you more concentrated than one broad fund. Diversification depends on what the funds hold and in what weights, not on how many funds you own.
This article is for educational and informational purposes only and is not financial, investment, tax or legal advice. FinCoach AI is not a broker or registered investment adviser. Investing involves risk, including the possible loss of capital. Do your own research and consider a licensed professional before acting. See our Terms.